Dashboard
The Dashboard is the primary screen in ACM and is used to access all the portal features. It displays the Certificate Requests and Expiring Certificates graph showing your Account activity. You can customize the graph to filter by Time Span, Time Period and the Graph Type.
The Dashboard will remember the last view chosen (either Certificate Requests or Expiring Certificates) and display it the next time you log in.
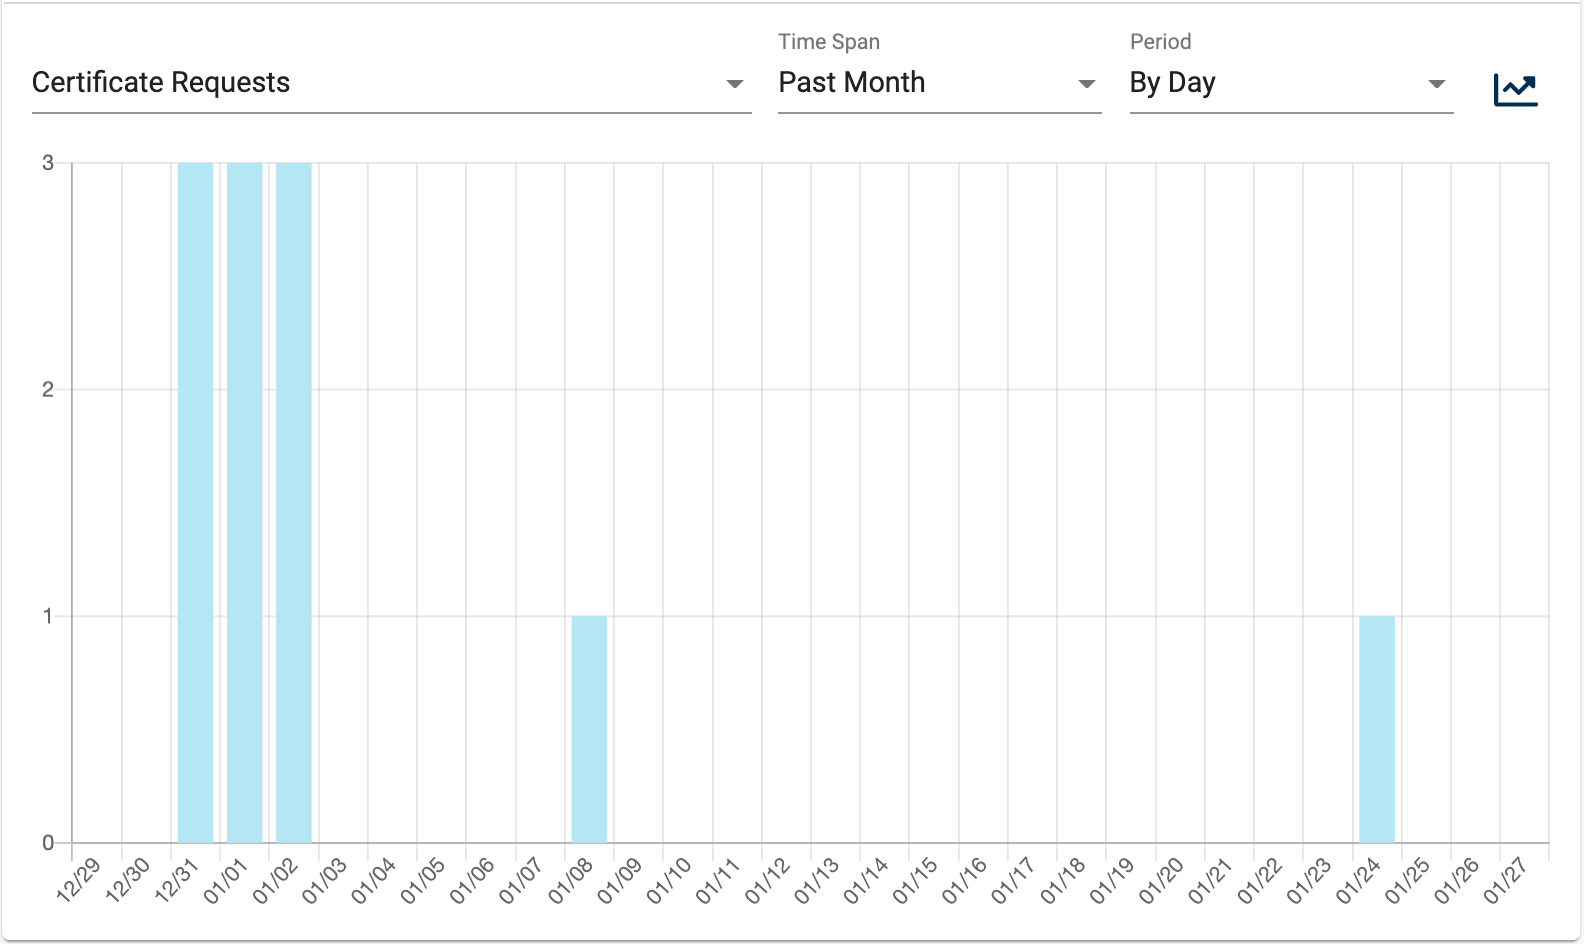
Certificate Requests
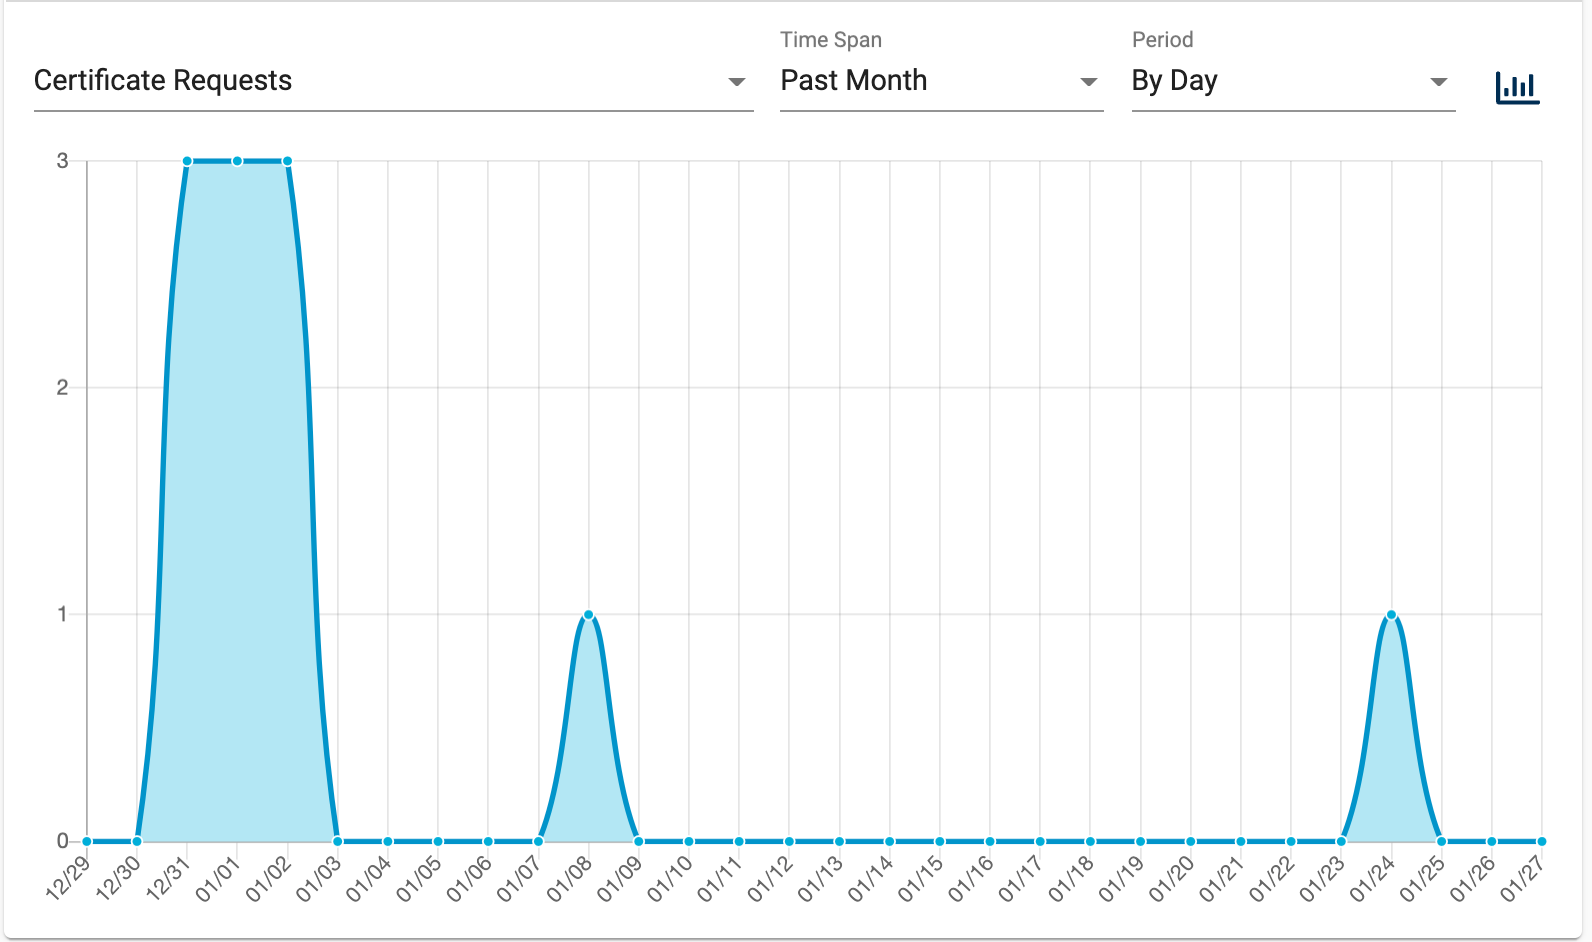
This view shows the certificates requested in your Account for a configurable time span. You can customize the graph to filter by Time Span, Time Period and the Graph Type.
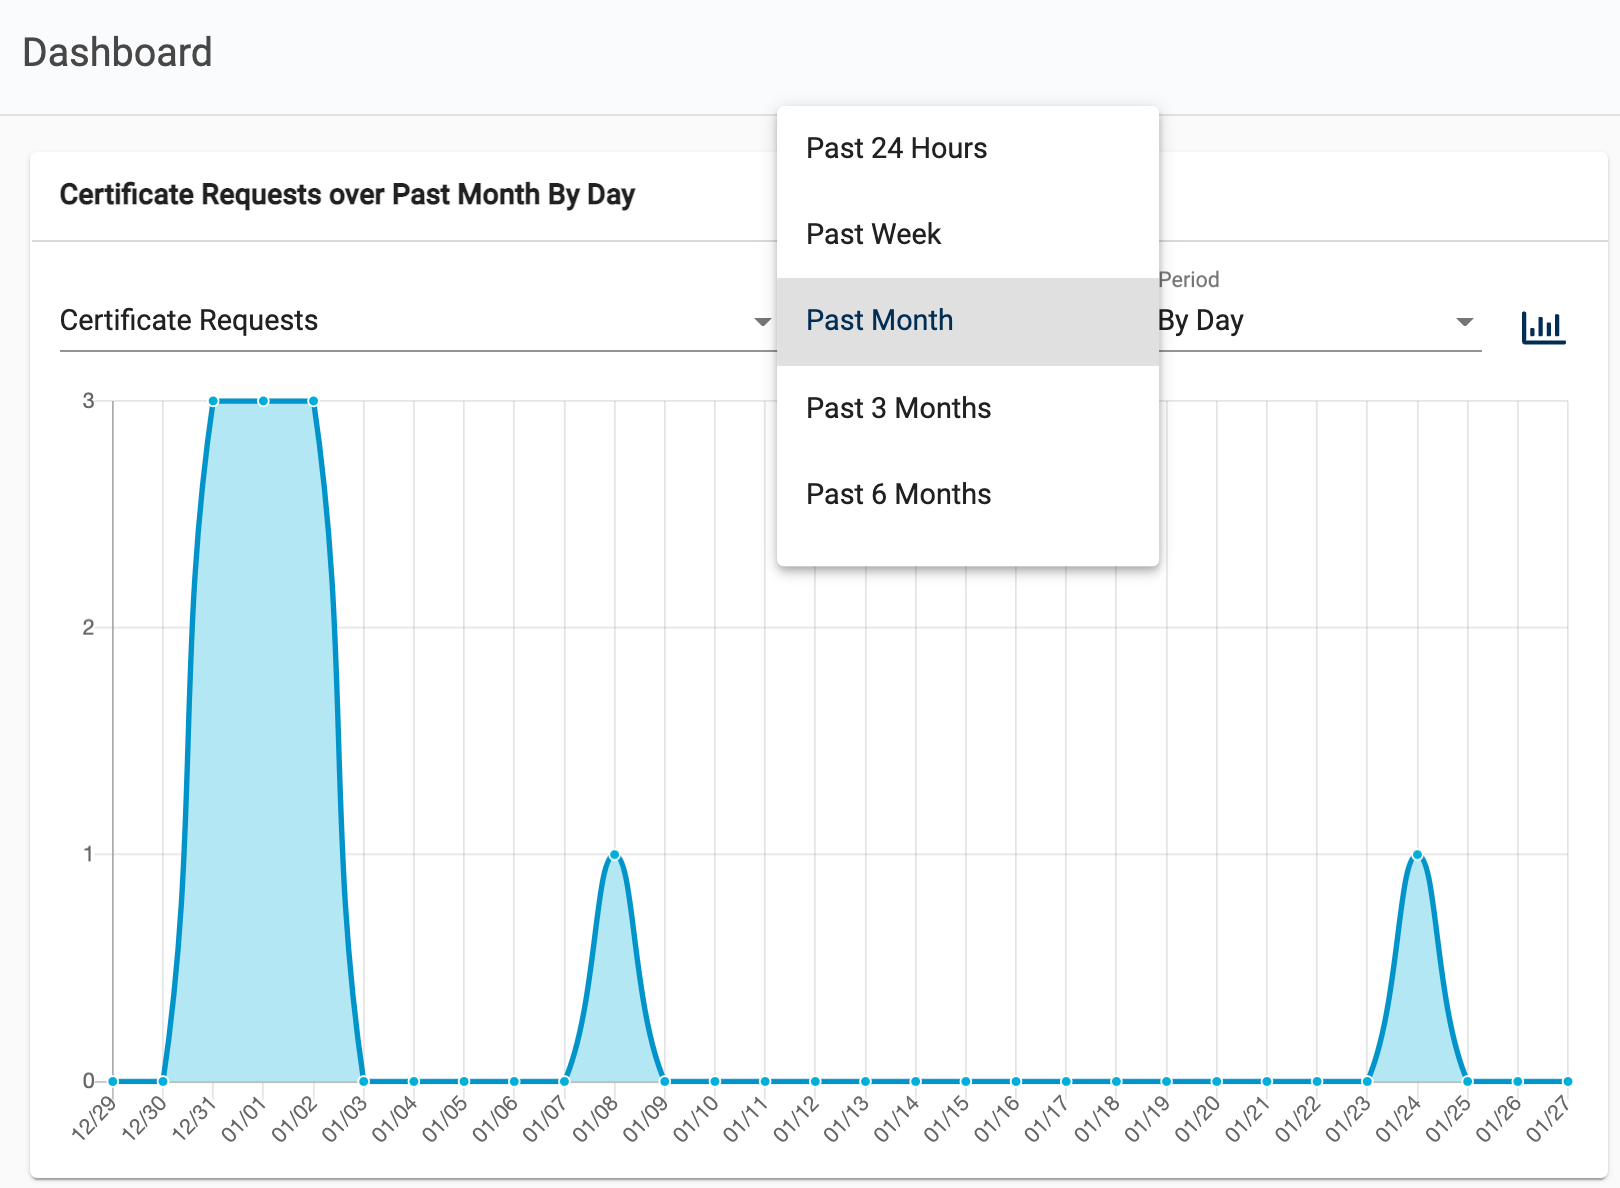
Filter by Time Span
You can change the Time Span to show the:
Past Day
Past Week
Past Month
Past Three Months
Past Six Months
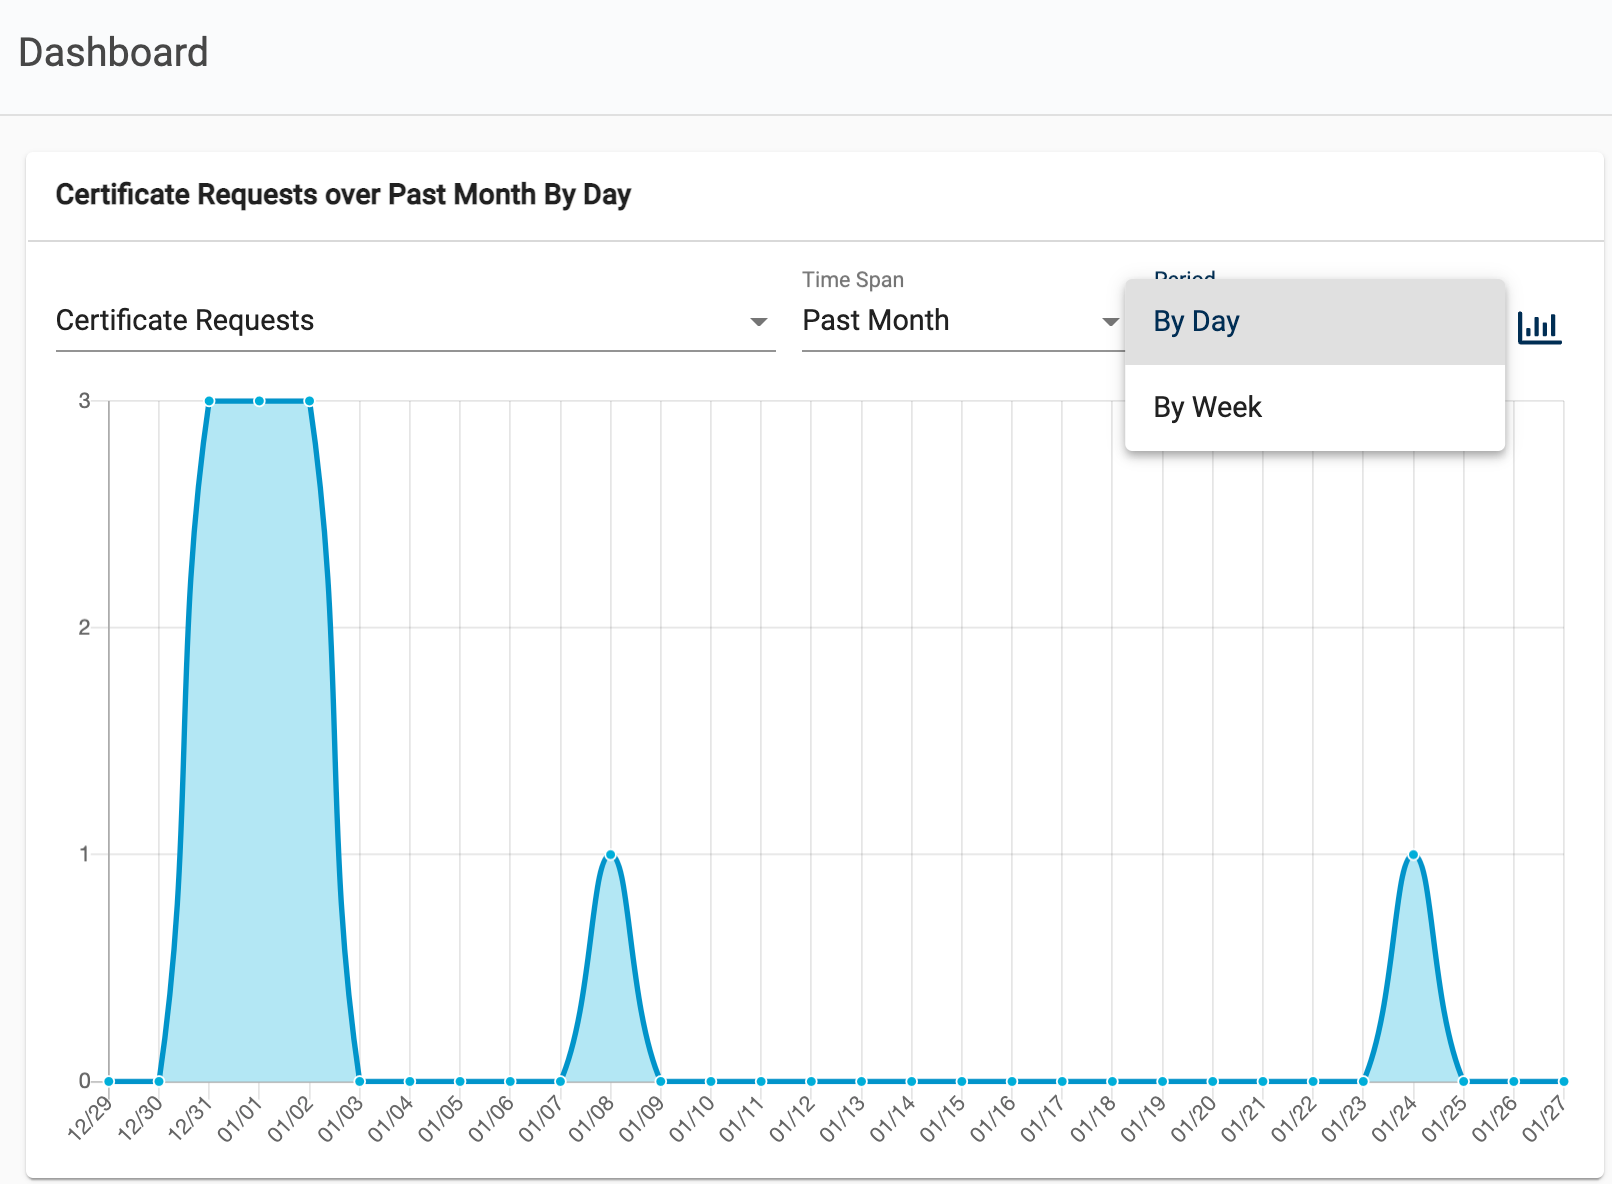
Filter by Graph Type
You can change the type of graph that is showing by clicking the Graph Selector Button:

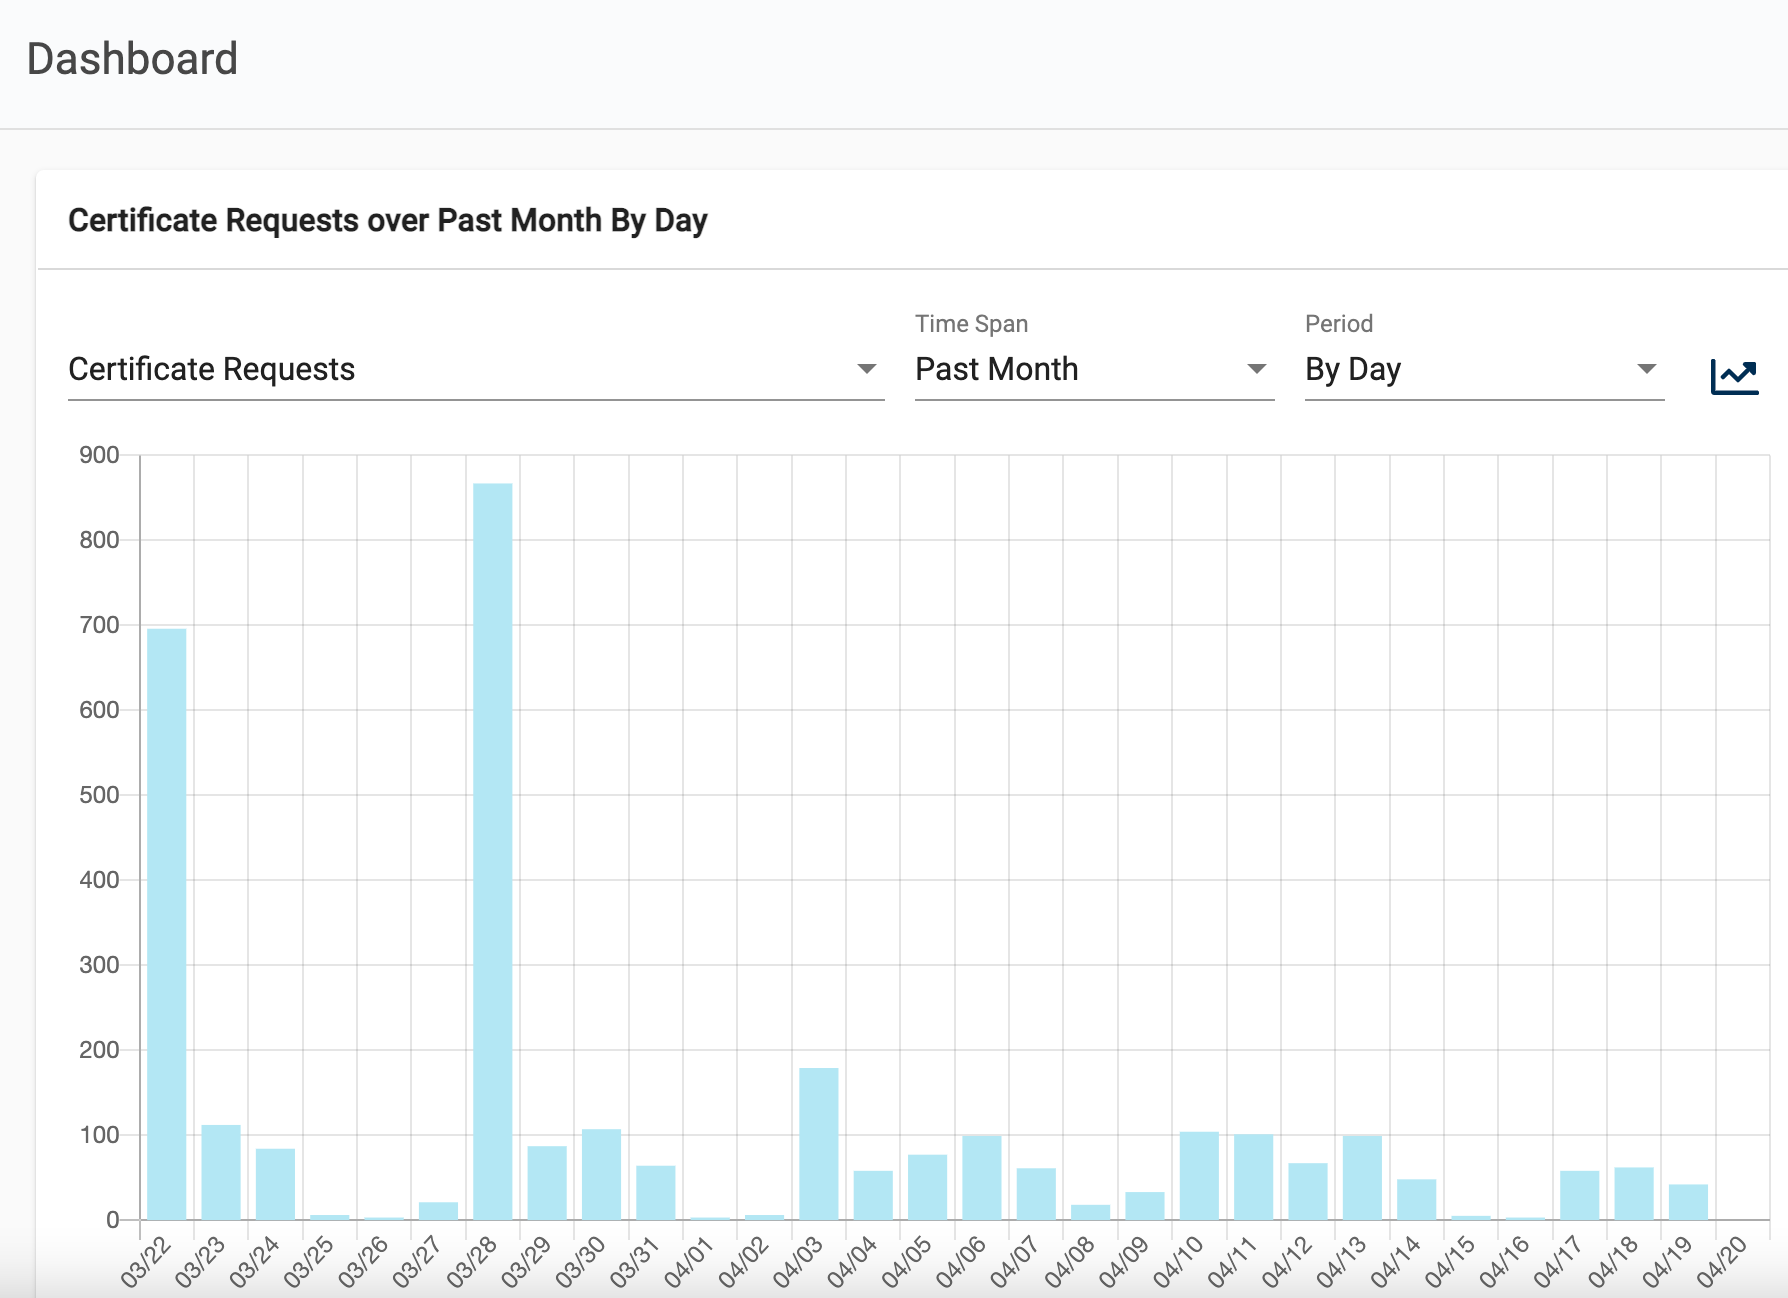
As a Bar Graph:
As a Line Graph: